Let me say first of all, that I mostly like Flot as a charting application. It provides a lot of charting functionality and is reasonably good looking.
But sometimes it is a bit of a pain to deal with. Case in point; I wanted to create a chart that had floating columns (Flot, in my opinion incorrectly, calls vertical columns, bars). In essence, what I wanted was this:
Well, it can be done but, after I spent far too many hours trying to figure out how, it is not exactly clear how to do it.
The first thing I learned was that the data format for a bar is the opposite of what one would intuitively expect. That doesn’t mean that it’s wrong (it make sense in retrospect), it’s just not intuitive.
If you want to float a bar/column in Flot you do it in the following format:
[[index, max, min]]
I had figured that min would come before max. But that does not.
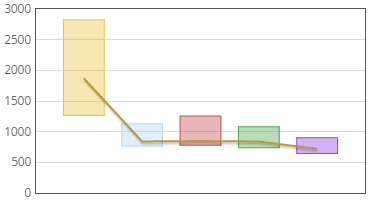
But that does not completely solve the problem because Flot does not allow you to control how the bottom bar is rendered; it is automatic. And that automatic rendering removes the bottom border with no option to force it. The result of the previous JavaScript array is:
That’s not horrible, but the lack of a bottom looks a little cheap. The solution? Create a second item in your dataset like this:
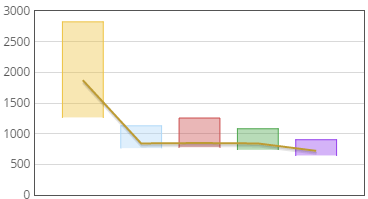
[[index, max, min]],
[[index, min, min]]
It feels a little dirty but it works. You are creating a 1px border by putting another column with no height immediately below your column. This is the result:
Comments
No comments yet...